The 15 largest one-day bitcoin price moves on the days the US Bureau of Labor Statistics published its monthly Consumer Price Index (CPI), out of all 80 releases from January 2020 to September 2026, ranked by the size of the move.
Data as of · BTC daily closes in USD (UTC days) from Yahoo Finance · next CPI release Oct 14, 2026
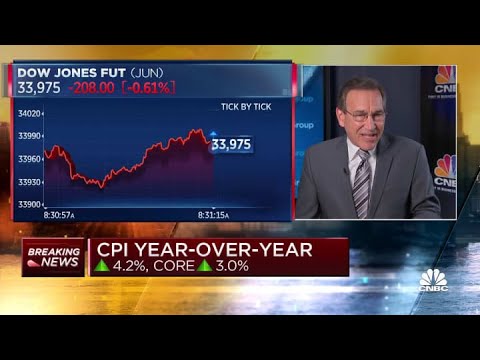
Pictured: CNBC’s May 12, 2021 report on the April 2021 CPI, which showed prices up 4.2% over the year. That release day ranks #1, with bitcoin down 13.32%.
Bitcoin’s Biggest Moves on CPI Release Days, data as of 2026-10-06
BTC move = bitcoin’s close on the release day ÷ its close the day before, minus 1, using UTC calendar days. BLS publishes CPI at 8:30 a.m. Eastern, which falls inside that UTC day, so the move includes everything else that happened that day too. Ranked by size, rises and falls together. CPI m/m is the seasonally adjusted monthly change in headline CPI-U, and y/y the 12-month change before seasonal adjustment, both as first published. October 2025’s CPI was never published because of the 2025 lapse in federal appropriations.
The top 8
The Consumer Price Index (CPI) is the US government’s main measure of inflation: the change in prices for a fixed basket of goods and services bought by urban consumers. BLS publishes it monthly, about two weeks after the month ends, at 8:30 a.m. Eastern.12 The Federal Reserve aims for 2% inflation over the longer run and sets interest rates with that goal in mind, so each CPI print is closely watched across markets, bitcoin included.3
Across all 80 releases from January 2020 to September 2026, bitcoin closed higher on 44 release days and lower on 36. Its average one-day move on a release day, up or down, was 2.6%, against 2.1% across all days in the same period.4 The next CPI release, for September 2026, is scheduled for October 14, 2026.2
#1
May 12, 2021 April 2021 CPI
▼ −13.32%
The April 2021 report showed prices up 0.8% in a month and 4.2% over the year. BLS called that “the largest 12-month increase since a 4.9-percent increase for the period ending September 2008”, with used cars and trucks up 10.0% in a single month, the biggest monthly jump since that series began in 1953.5 Bitcoin closed the day 13.3% lower, at $49,151, its largest one-day fall since March 12, 2020.4
#2
Nov 10, 2022 October 2022 CPI
▲ +10.74%
October 2022’s CPI rose 0.4% for the month, and the annual rate came in at 7.7%, down from 8.2% in the September report.67 Bitcoin had closed at $15,881 the previous day. On release day it gained 10.7% to $17,587, its biggest one-day rise since February 28, 2022.4
#3
Jan 13, 2021 December 2020 CPI
▲ +10.00%
The December 2020 report showed a 0.4% monthly rise and 1.4% over the year, with an 8.4% jump in gasoline making up more than 60% of the monthly increase.8 Bitcoin had closed above $40,000 for the first time on January 8, then fallen back to $33,923 by January 12. On release day it rebounded 10.0% to $37,316.4
#4
Sep 13, 2022 August 2022 CPI
▼ −9.27%
August 2022’s CPI rose 0.1% for the month and 8.3% over the year. A 10.6% fall in gasoline prices was “mostly offset” by increases in shelter, food and medical care, BLS said, and core CPI (all items less food and energy) rose 0.6%.9 Bitcoin closed 9.3% lower at $20,297.4
#5
Jan 14, 2020 December 2019 CPI
▲ +8.39%
The first release in this table’s window: December 2019’s CPI was up 0.2% for the month and 2.3% over the year.10 Bitcoin rose 8.4% to $8,828, from a much lower base than any other entry here.4
#6
May 15, 2024 April 2024 CPI
▲ +7.66%
April 2024’s report showed prices up 0.3% for the month and 3.4% over the year. Core CPI rose 0.3%, after 0.4% in each of the three months before.11 Bitcoin gained 7.7% to $66,267, its biggest one-day rise since March 20, 2024.4
#7
May 11, 2022 April 2022 CPI
▼ −6.73%
April 2022’s CPI rose 0.3% in the month, after 1.2% in March, and 8.3% over the year.12 Bitcoin fell 6.7% to $28,936. That was its second large fall in three days: it had dropped 11.1% on May 9.4
#8
Mar 10, 2022 February 2022 CPI
▼ −6.06%
February 2022’s report showed a 0.8% monthly rise and 7.9% over the year. Gasoline alone rose 6.6% and accounted for almost a third of the monthly increase.13 Bitcoin fell 6.1% to $39,437.4